Brexit Analysis

Analysis of Brexit votes in 2016 and electoral % of parties in the 2015 general elections
Reading the data
brexit_results <- read_csv("https://raw.githubusercontent.com/kostis-christodoulou/am01/master/data/brexit_results.csv")Plotting the Information
brexit_results_long <- pivot_longer(brexit_results,
                                    col = c("con_2015", "lab_2015","ld_2015", "ukip_2015"),
                                    names_to = "party",
                                    values_to = "party_percentage") %>%
  summarize(Seat, party, party_percentage, leave_share)
brexit_results_long
## # A tibble: 2,528 × 4
## Seat party party_percentage leave_share
## <chr> <chr> <dbl> <dbl>
## 1 Aldershot con_2015 50.6 57.9
## 2 Aldershot lab_2015 18.3 57.9
## 3 Aldershot ld_2015 8.82 57.9
## 4 Aldershot ukip_2015 17.9 57.9
## 5 Aldridge-Brownhills con_2015 52.0 67.8
## 6 Aldridge-Brownhills lab_2015 22.4 67.8
## 7 Aldridge-Brownhills ld_2015 3.37 67.8
## 8 Aldridge-Brownhills ukip_2015 19.6 67.8
## 9 Altrincham and Sale West con_2015 53.0 38.6
## 10 Altrincham and Sale West lab_2015 26.7 38.6
## # … with 2,518 more rowsparty_colours = c("#0087DC", "#E4003B", "#FAA61A", "#FFD700")
parties = c("Conservaltive", "Labour", "Lib Dems", "UKIP")
g <- ggplot(brexit_results_long, aes(x = party_percentage, y = leave_share, colour = party)) +
geom_point(size = 0.3) +
geom_smooth(method = lm) +
scale_colour_manual(labels = parties, values = party_colours) +
labs(
title = "How political affiliation translated to Brexit voting"
) +
ylab("Leave % in the 2016 Brexit referendum") +
xlab("Party % in the UK 2015 general election") +
theme(legend.position = "bottom") +
theme(legend.title=element_blank())
g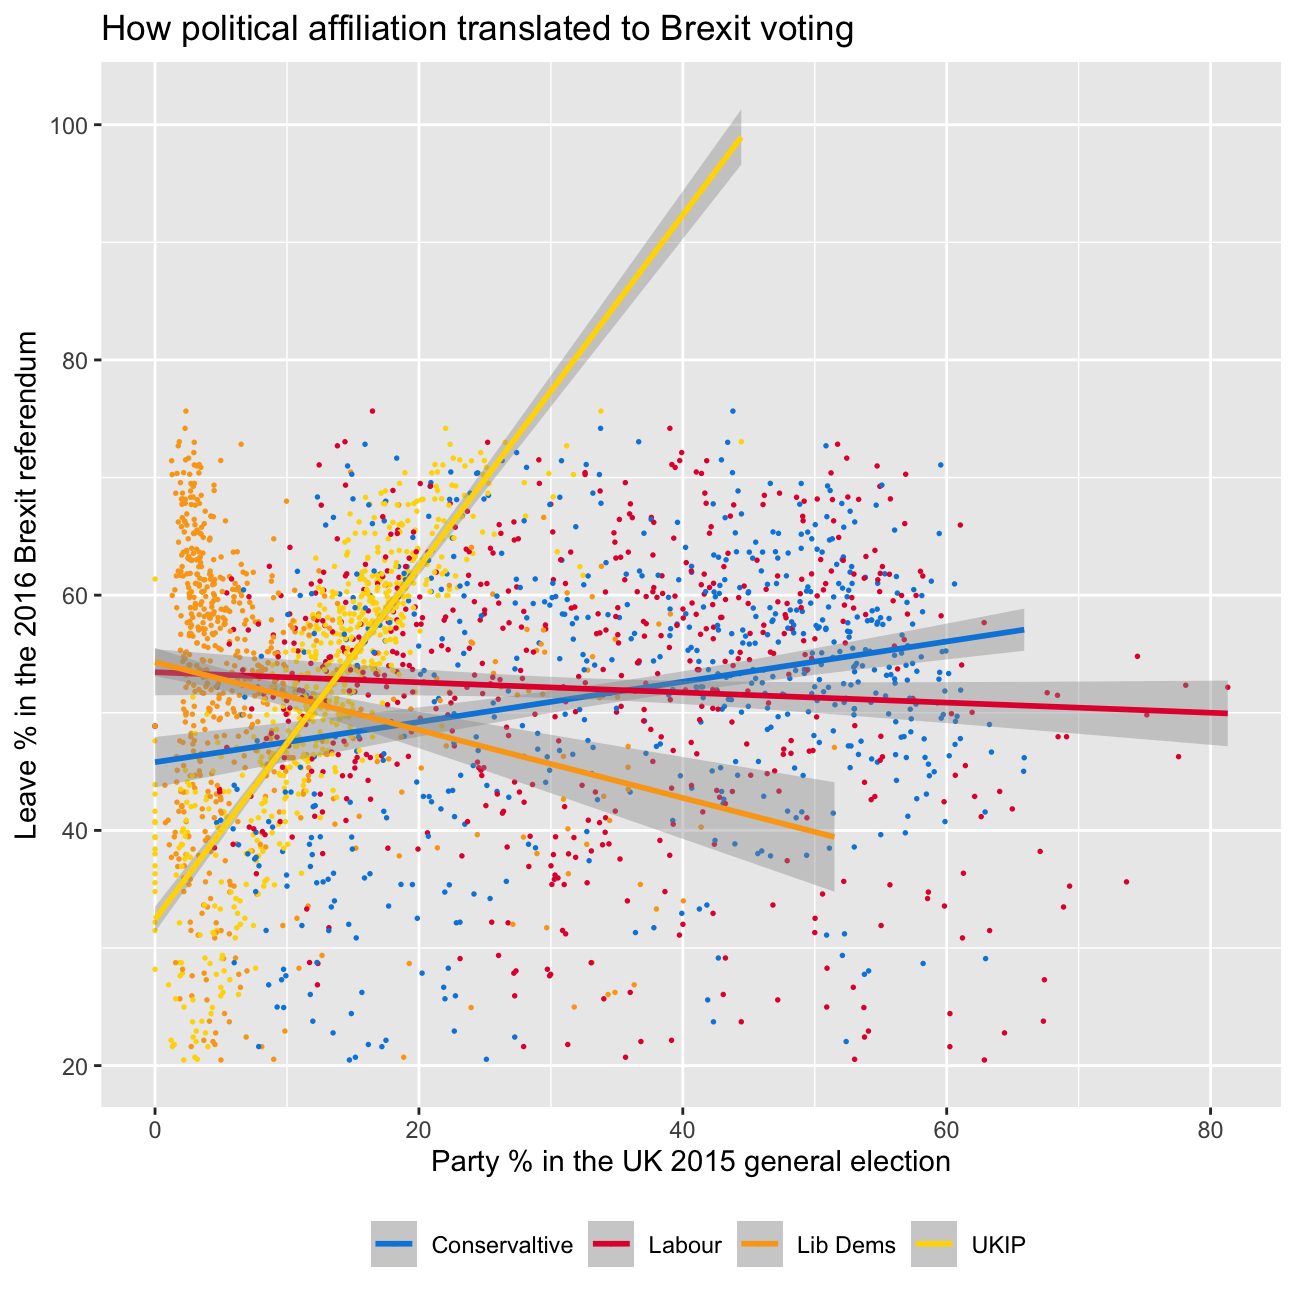
Looking at this graph, we can see that there is a moderate negative correlation between LibDem percentage and voting for Brexit. On the other hand, what stands out, is a high correlation between the UKIP percentage and voting for Brexit. This is not very surprising given that UKIP (UK Independence Party) was at the forefront of leading the Brexit campaign. Moreover, we can also observe a slight positive correlation between conservative % and leave %.